Got to the Peanut Software page and download Winplot. Install (unzip) it onto the desktop if you are in the lab (if it’s your home computer, of course, you can install it wherever you wish).
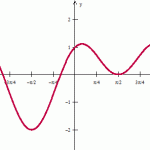
You can make 2D graphs of equations (Equa), and set the color and pen width however you want it to be; you can change the window (View), and you can change the labels on the axes, and add grid lines if you wish. For example:
You can also make 3D graphs.
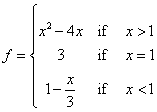
Assignment: Make 2 cool 2D graphs and 2 cool 3D graphs (must be different from the default functions supplied by WinPlot), and copy them into a Word document to turn in. Then figure out how to make Winplot graph this 2D piecewise defined function:
(When graphing the piecewise function–make sure you have filled in points and open dots in the right places, and please make all 3 parts of the function the same color).
Paste your graph into your Word document. Upload it to D2L.


Post a Comment